
First We Visualize

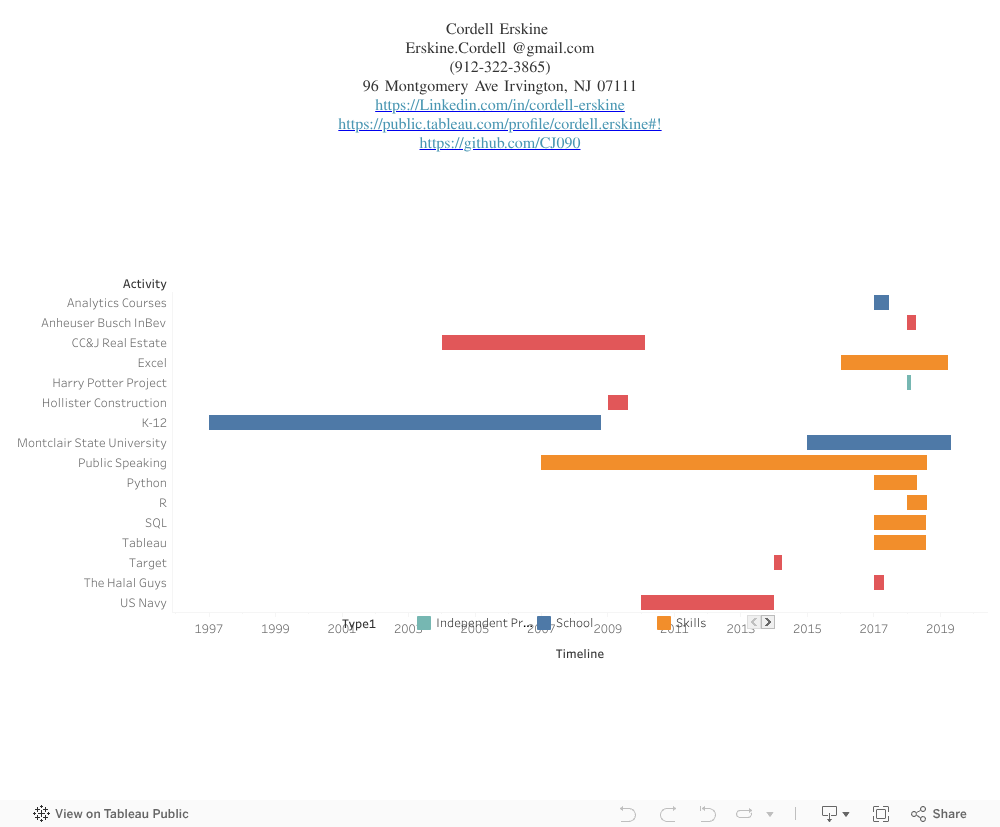
I was told by a friend that this was a good idea to show off some basic Tableau-fu. Take a look at my resume. It's time for a bit of an update need to add some degree completions and successful internships and skills (and yes, they pay the bills).


Coming Soon... we take a look at some unstructured data analysis in python. get your steins out because we're talking beer.

Comments

Popular posts from this blog

Intro - Stunting Is A Habit

HIRE ME!!! My name is Cordell and I am on a journey into the mind. This is not a blog about psychedelic drugs or meditation; (that's my other blog) no, I am talking about a journey into the mind of the consumer. I'll illustrate why with my anecdote. In high school before I was eligible to work I needed to find a way to make some money. Drugs? No. Robbing? No. My solution was selling candy. The JROTC which I was apart of had a candy fundraiser and during the month of September each year there were colorful yellow boxes traveling the halls of my high school always open for business. I found that I could buy my own candy, sell it along with the fundraising candy and make 2, 3, 4x profit. And the strange behavior pattern jumped out at me. There were students determined to show their discretionary income to their peers and would be my best customers. They had a deep and burning desire to appear as if they had money. It's a concept in the hip-hop community called stunting...

Farmers Markets - Only for the privileged?

I come from a low income area. The concept of a farmers market was alien to me growing up. In the late 2000s health trends began to spike and farmers markets began to see an increase in customer traffic.  I found a dataset on Kaggle of all the existing farmers markets in the US and while learning about tableau maps and geospatial data had an idea for exploratory data visualization.